What stats is about (yet again)
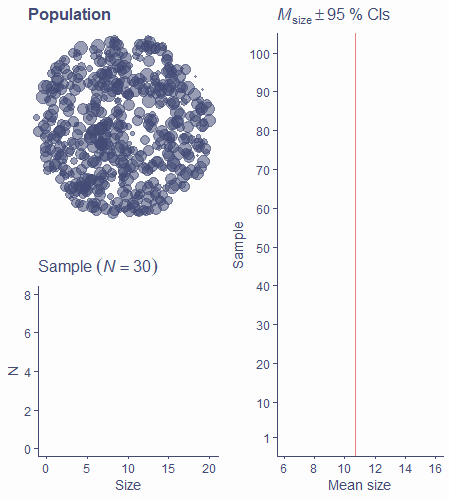
We want to know about the world (population)
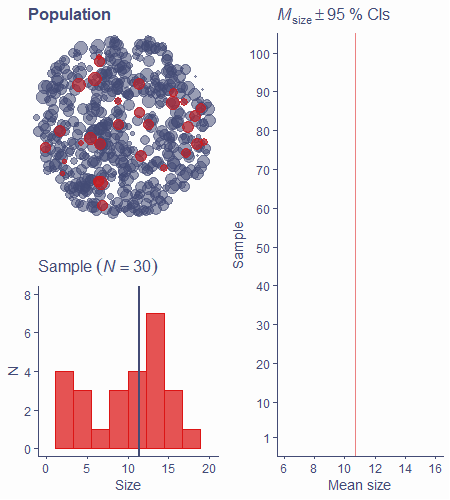
We can only get data from samples
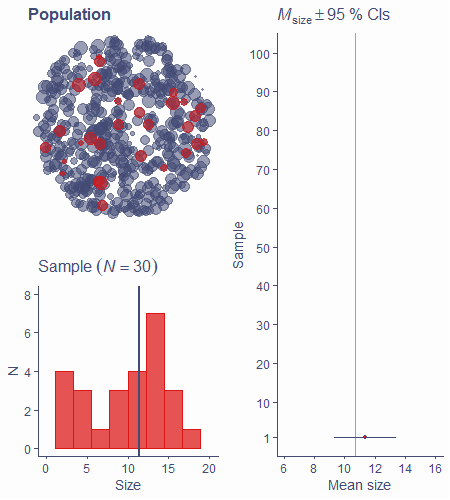
We calculate statistics on samples and use them to estimate the values in population
Statistics is all about making inferences about populations based on samples
If we could measure the entire population, we wouldn't need stats!
 PDF
PDFPoint estimates
You've heard of the sample mean, median, mode
These are all point estimates - single numbers that are our best guesses about corresponding population parameters
Measures of spread (SD, σ2, etc.) are also point estimates
Even relationships between variables can be expressed using point estimates
 PDF
PDFAccuracy and uncertainty
Sample mean ¯x is the best estimate ^μ of population mean but means of almost all samples differ from population mean μ
Same is true for any point estimate
SE of the mean expresses the uncertainty about the estimates of the population mean
SE can be calculated for other point estimates, not just the mean
We can quantify uncertainty around point estimates using interval estimates
 PDF
PDFInterval estimates
In addition to estimating a single value, we can also estimate an interval around it
e.g., mean = 4.13 with an interval from −0.2 to 8.46
Interval estimates communicate the uncertainty around point estimates
There are different kinds of interval estimates
- Important: confidence intervals
 PDF
PDFConfidence interval
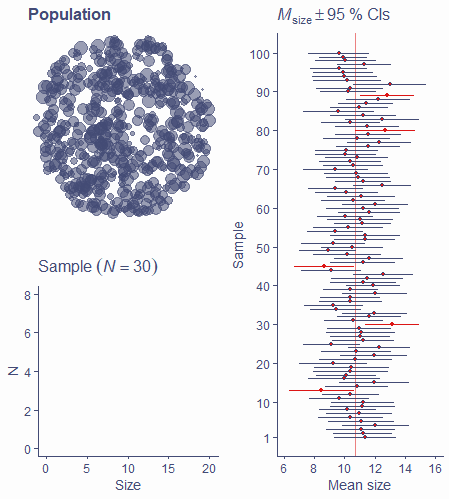
We can use SE and the sampling distribution to calculate a confidence interval (CI) with a certain coverage, e.g., 90%, 95%, 99%...
For a 95% CI, 95% of these intervals around sample estimates will contain the value of the population parameter
Let’s see an example
 PDF
PDFHow is it made?
Easy if we know sampling distribution of the mean
95% of sampling distribution is within ±1.96 SE
95% CI around estimated population mean is mean ±1.96 SE
 PDF
PDFHow is it made?
Sampling distribution is, however, not known!
It can be approximated using the t-distribution and s and N
 PDF
PDFt-distribution
- Symmetrical, centred around 0
- Its shape changes based on degrees of freedom
- As shape changes, so do proportions (unlike with normal)
- In standard normal, middle 95% of data lie within ±1.96
- In t-distribution, this critical value changes based on df
 PDF
PDFt-distribution
t-distribution crops up in many situations
Always has to do with estimating sampling distribution from a finite sample
How we calculate number of df changes based on context
Often has to do with N, number of estimated parameters, or both
In the case of sampling distribution of the mean, df = N − 1
 PDF
PDFBack to CI
95% CI around estimated population mean is mean ±1.96 SE if we know the exact shape of sampling distribution
- We don't know the shape so we approximate it using the t-distribution
We need to replace the 1.96 with the appropriate critical value for a given number of df
For N = 30, tcrit(df=29) = 2.05
qt(p = 0.975, df = 29)## [1] 2.04523 PDF
PDFBack to CI
95% CI around the mean for a sample of 30 is ¯x±2.05×SE
ˆSE=s√N
95% CI=Mean±2.05×s√N
To construct a 95% CI around our estimated mean, all we need is
- Estimated mean (i.e. sample mean, because ^μ=¯x)
- Sample SD (s)
- N
- Critical value for a t-distribution with N − 1 df
 PDF
PDFCIs are useful
Width of the interval tells us about how much we can expect the mean of a different sample of the same size to vary from the one we got
There's a x% chance that any given x% CI contains the true population mean
CAVEAT: That's not the same as saying that there's a x% chance that the population mean lies within our x% CI!
CIs can be calculated for any point estimate, not just the mean!
 PDF
PDFTake-home message
- Our aim is to estimate unknown population characteristics based on samples
- Point estimate is the best guess about a given population characteristic (parameter)
- Estimation is inherently uncertain
- We cannot say with 100% certainty that our estimate is truly equal to the population parameter
- Confidence intervals express this uncertainty
- The wider they are, the more uncertainty there is
- They have arbitrary coverage (often 50%, 90%, 95%, 99%)
- CIs are constructed using the sampling distribution
- True sampling distribution is unknown, we can approximate it using the t-distribution with given degrees of freedom
- CIs can be constructed for any point estimate
- For a 95% CI, there is a 95% chance that any given CI contains the true population parameter
 PDF
PDF